
This season we have meticulously recorded the attendances of Europe’s major leagues. No easy task, especially in the southern parts of Europe, but we managed and are now ready to present our analysis. Some of the outcomes are fairly well-known, but we think we can also show you some analysis that you have not seen before.
When we talk about Europe’s major leagues, we talk about England, Germany, Spain, Italy, France, and Holland. Whether Holland should be in there can be debated, but from an attendance point of view it certainly does. You will see why.
Bear in mind to interpret the statistics we are going to present as rough numbers as there is no such thing as an exact attendance statistic1.
Let’s start with the obvious, which are the annual averages of each country. These are likely figures you have already seen before.
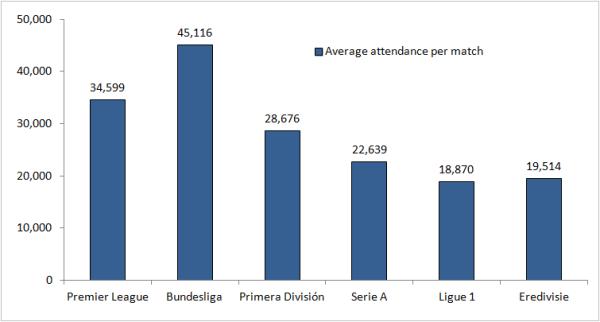 The Bundesliga is the absolute king of attendances with an average topping 45,000, almost a quarter more than the Premier League who are second on the list. What is most striking, perhaps, is the small difference between the bottom three countries and that the Dutch Eredivisie has passed the French Ligue 1 in terms of attendances.
That said, presenting averages is all well, but perhaps not as good a measure if we want to know how many spectators a “typical” match attracts. After all, most leagues have several big teams with large stadiums pulling up the average.
Statistics buffs will already know that instead of looking at the average it is in this case better to look at the median. Statistical explanation: say you have 380 matches a year (Premier League) and you rank the attendances from lowest to highest, than the median is the attendance exactly in the middle, so the 190th, which makes it your typical attendance2.
We present you the medians in the next table along with the lowest and highest attendance recorded, as well as the attendances at the first quartile (the 96th attendance in the ranking of 380 attendances, i.e. the one at 25%) and the third quartile (the one at 75%, or the 285th of 380 attendances).
 We see what we already predicted: that median attendances are lower than the averages, though the difference is very small for the Bundesliga. This is because the few Bundesliga clubs that pull up the average are balanced by quite a few stadiums that have a capacity of around 30,000.
The reason we included the first and third quartile is that it gives us a good sense of the distribution of the attendances. After all, one can get to an average of 30,000 through 20 clubs with average attendances of around 30,000, or 10 with averages of 10,000 and 10 with averages of 50,000.
What we see it that the Premier League, Bundesliga and Ligue 1 have a third quartile that is less than double the first quartile, which means that there is a relatively even playing field. The Primera División, Serie A, and to a lesser extent the Eredivisie, all have a third quartile that lies more than twice as high as the first, which means that there is a relatively big difference between the higher and lower attendances.
A logical next step is to look at how well the clubs in each country are able to fill their stadiums. In the next chart you see the same blue attendance columns as in the first chart, however now part of a larger white column, which is the average capacity of the stadiums. The percentage is the average attendance divided by the average capacity. Let’s call this the occupancy rate.
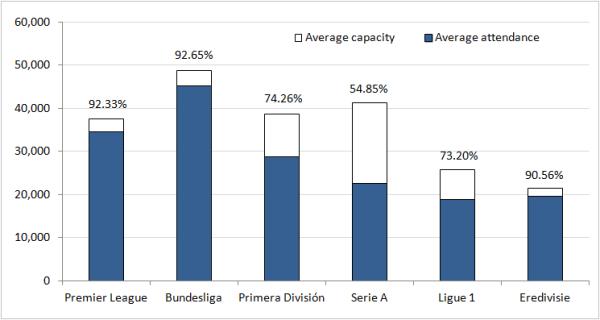 The Bundesliga and Premier League clubs were all able to sell over 92% of their seats, followed closely by the Dutch with almost 91%. No wonder, as these three leagues consist mainly of new or redeveloped stadiums that offer good facilities. What’s more, during these redevelopments capacity often got scaled back as a full stadium was considered more important than a large stadium.
Worryingly though, is the occupancy rate of the Serie A. It narrowly manages to fill half of all seats, and one cannot avoid the conclusion that it urgently needs to renovate and reduce the capacity of its stadiums. Which is exactly what Juventus did, the only exception in the Serie A with an occupancy rate of over 90%.
Related to the occupancy rate is the percentage of sold out matches. We were actually somewhat reluctant to report on this as it is often hard to determine when a match is exactly sold out. After some analysis we however think that an occupancy rate of 97% more or less captures3 a sold out match, and the broad picture is still interesting enough to report on.
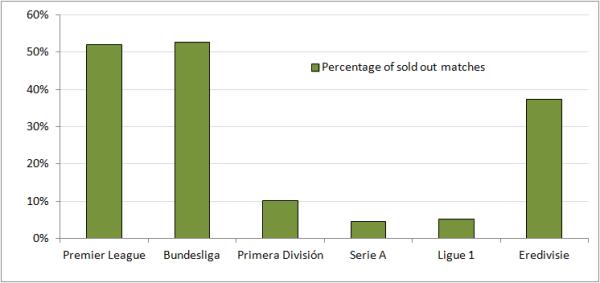 Not much of a different picture here, with again the Bundesliga and Premier League on top with over half of all matches sold out. The following chart complements the picture:
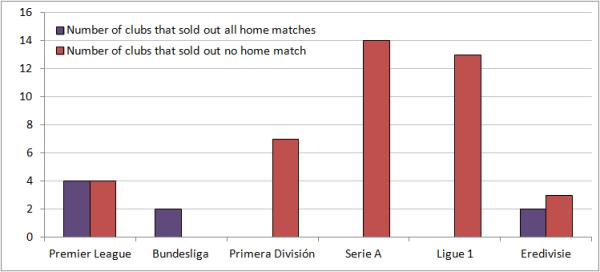
All Bundesliga clubs sold out at least one home match (versus FC Bayern), and there are even a few that sold out all of them, though not in the Primera División, Serie A, and Ligue 1.
Sold out figures for Ligue 1 may actually be slightly better than they seem as quite a few clubs recorded its highest occupancy rate just below the 97% threshold.
Another thing we can analyse is how attendances developed over the year. What one might expect are high attendances at the start of the season (early season enthusiasm), then a slight mid-season dip, and increasing attendances toward the last and exciting part of the season.
The following chart shows how the average attendances change over the either 17 or 19 home matches the teams played this season.
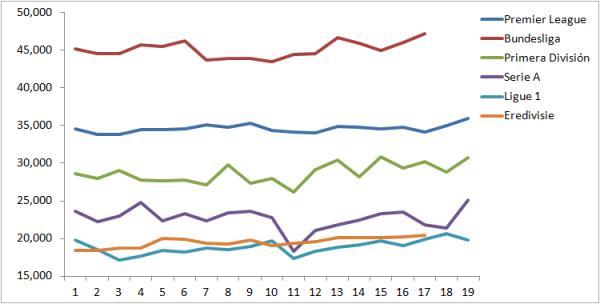
Our hypothesis is about right for the Bundesliga, Serie A, and Ligue 1. Attendances in the Premier League are quite evenly divided over the year, though there is a clear increase at the end of the year. That said, the on average second best visited home match in England was the 9th home match. Indeed, the late-December holiday fixtures.
What is clear is that in all leagues attendances increased significantly towards the end. In four of the six leagues the best attended home match was the last one. In Ligue 1 it was the second to last, whereas the last home match in the Primera División was the second best attended.
Also noticeable are the slow starts of the Premier League and in particular the Eredivisie. They both recorded their lowest attendances at the start of the season, while the other leagues had their lowest attendances mainly mid-season.
What furthermore catches the eye is that in all leagues there was a significant dip at either the 10th or 11th home match. What happened? Well, someone living in Europe will probably look back at last winter as pleasantly mild. Except for about two very nasty weeks in early February when in most of Western Europe temperatures dropped to below zero, often accompanied by quite a bit of snow.
The dip you see were those weeks, and likely would have been far more pronounced if clubs had not taken season tickets as a given and recorded the actual people that got in. Hence the relatively small decline in season ticket heavy Holland, whereas news reports indicated many half empty stadiums.
Finally, when one looks at the lines they seem to be far more even in some leagues than in others. Which brings us to our last analysis: the volatility of attendances in each country. In popular terms one might also define this as the fickleness of fans in each country, with the league with the attendances moving up and down the most having the most fickle fans4.
For this, we have calculated the standard deviation of each league, which basically measures what change (increase or decrease) one might expect from each home match to the next.
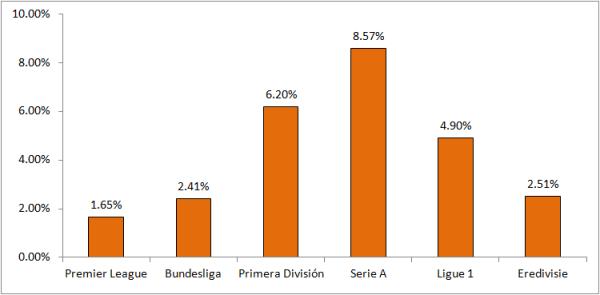
It is clear that attendances are most volatile in the Serie A. What we see there is that a lot more people show up when such teams as Juve and the Milan clubs come to town, and as most stadiums have a lot of free capacity it is common to see large differences per match.
We also see that attendances in the Premier League are more stable than the Bundesliga, partly because the number of sold out matches in Germany is divided over more clubs than in England. A visit of Bayern, for example, is a guaranteed sold out, whereas this is not the case for a Manchester United or Liverpool.
In the next couple of weeks we will zoom in from this high-level analysis to a detailed analysis of each of these countries, of course including a break-down of attendances by club. For any questions regarding this analysis, feel free to use the comment section below.
1 We could write a long essay about all the problems and assumptions involved in measuring attendances, but just trust us there are loads of them.
2 Actually the median is the average of the 190th and 191st, but let’s not complicate things too much.
3 Problems are that the capacity of a stadium is not necessarily the same as the number of available tickets (e.g. safety measures can reduce this) and the way clubs report their attendances can also affect their occupancy rate. Still, an occupancy rate of 97% includes the large majority of matches that we know were sold out.
4 Of course, this statistic not only measures fan loyalty, but is influenced by other factors as well.