We recently analysed the attendances of six of Europe’s major leagues: the Premier League, Bundesliga, Primera División, Serie A, Ligue 1, and Eredivisie.
While we looked at these attendances from different types of angles, we left out one analysis that we did, but wanted to present separately. Let’s start by warning that it is a rather light-hearted analysis and should not be taken too seriously.
This analysis deals with the appeal of clubs. Appeal is the quality that makes something attractive or interesting, and in contrast to looking at the home crowds of a club, we can measure appeal a lot better by the crowds they attract away from home.
We all know that certain clubs are more appealing than others. The people of, for example, Seville are far more likely to flock to Estadio Ramón Sánchez Pizjuán or Estadio Benito Villamarin when Barcelona and Messi come to town, than when, say, Levante pays a visit.
We have looked into this, come up with a list of clubs that are particularly appealing, the ones that aren’t, and perhaps the results can provide some conclusions on what makes a club appealing. Of course, most will already be able to fill in the usual suspects, but there are some surprises as well.
While the idea seems simple, the analysis is not as straightforward as it appears and therefore needs a little explanation. We have some further explanation at the end of the article for the statistics buffs.
The first major point is that we have taken the attendance data of two seasons. Why not just one? Well, because we want to filter out “exceptional” and “unlucky” attendances that might disturb the outcomes. We prefer to make conclusions on the general popularity of clubs, and not the popularity in one season.
So why not then use three, four, or five seasons of data? Well, we would have loved to, but we simply only have two seasons in our database, and collecting extra seasons of data would be too much work. After all, it is a fun analysis. Still, we think two seasons give us rather reliable outcomes. The consequence is that we have only included the teams that were in the top league in both seasons (2010-11 and 2011-12).
We have used three metrics to measure popularity as we noticed that if we used just one, the same “exceptional” attendances somewhat influenced the outcomes. These metrics are:
- The average occupancy rate of the stadiums that each club visited during the two seasons.
- The average rank of each club’s away attendances compared to the other clubs.
- The number of extra spectators a club attracts away from home in comparison to the average. This metric is actually very similar to the first one apart from a small statistical difference.
The three metrics all have their advantages and disadvantages, which we discuss at the bottom of the article. While this may all seem very technical, it is best to just look at the numbers to get rid of any confusion.
The tables we present show the scores and ranking of each club on each metric. The clubs are sorted based on the average of the three metrics.
We start with the Premier League (PL):
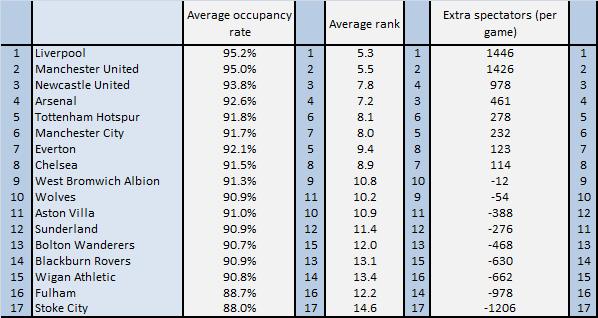
Let’s use an example to explain things better: Liverpool vs Stoke. Liverpool turns out to be the most appealing team, whereas Stoke is the least appealing. Liverpool on average fills 95.2% of all seats when they play away from home, the most in the PL, whereas Stoke only fills 88% of the seats.
Liverpool were a few times the club that attracted the highest attendances, a few times the 2nd or 3rd ranked, but also a few times only 9th or 10th ranked, resulting in an average of 5.3. This average of 5.3 was still the best of all PL teams though.
Finally, Liverpool attracted on average 1,446 more people on their away trips than the average of the other teams, again the best in the PL. In comparison, Stoke sold 1,206 tickets less than the average.
Some observations we can make based on the PL data:
- While the talk is often about the “Big 4” or “Big 5” when it comes to performance, there really only are a “Big 2” if it comes to appeal. Liverpool and Manchester United rank significantly ahead of the rest, and this is despite a less than stellar Liverpool team in the last two seasons.
- Newcastle does surprisingly well, though they have the advantage of having a derby rival with a lot of free capacity (Sunderland). Still, they are competitive with the likes of Arsenal, Spurs, and Chelsea, and in particular the latter disappoints.
- People often joke about Stoke’s not-so-spectacular football, and this seems to have affected the enthusiasm of the home crowds when Stoke come to visit. They are well below the rest and ranked bottom on all metrics in both seasons. Whether it’s fair or not, on average 1,206 people prefer to spend their afternoon differently than see their team struggle versus Stoke.
- Fulham’s occupancy rate got affected by a few exceptional attendances, and their ranking (where they rank 14th) suggests they are more equal with the other bottom teams than the overall ranking suggests.
- Overall, when we compare the PL with the other leagues, the differences between the teams are relatively small, which means that people come to the stadium regardless of the opponent.
It is important to realise that the occupancy rate and extra spectators metric get mainly determined by the clubs that have free capacity, and even more so by those with very volatile attendances. The occupancy rate of the Emirates Stadium is, for example, always close to 100%, whereas the attendances at the Reebok Stadium tend to swing significantly. This, however, does not affect the second metric.
Of course, there are also the away fans a team brings that may affect the numbers, but the data we have makes no distinction and we have therefore left this out of consideration.
Next up is the Bundesliga:
 Our observations:
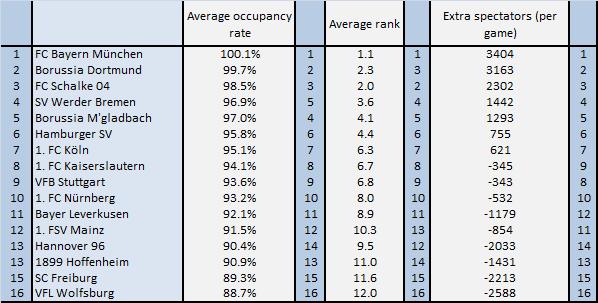
- Bayern sells out wherever they go, resulting in the only perfect score of all teams in all leagues. Very impressive.
- Borussia Dortmund and Schalke are a solid second and third, and Dortmund is increasingly coming close in equalling Bayern.
- Attendances seem to be more influenced by the status of the visiting team than in the Premier League. Whereas there was little difference between the PL clubs, we can distinguish a much more clear ranking from top to bottom in the Bundesliga.
- There is a clear performance effect visible with Borussia Mönchengladbach. It is a team with a rich history that already ranked among the most appealing in the 2010-11 season, but they came a lot closer to the top 3 in their successful 2011-12 season.
- Wolfsburg’s bottom position is somewhat surprising, after all, they were German champion only a few years ago and tend to invest in quite a few attractive players. Unlike Stoke, they did not rank bottom on every metric though, but still came out clearly as the least appealing team.
Premier League attendances tend to get reported up to the single seat and even when clubs sell out there are still some differences. In Germany, on the other hand, they often just give the exact same number. This means that multiple teams get ranked first (or all teams in the case of the Allianz Arena), which in turn means that the average rank metric gets skewed upwards (just in case you wondered).
Now the Primera División. We did not manage to get attendance data for the 2010-11 Primera División season retroactively, so only have one season of attendances. It is important to bear this in mind as it makes the numbers much more volatile.
 Our observations:
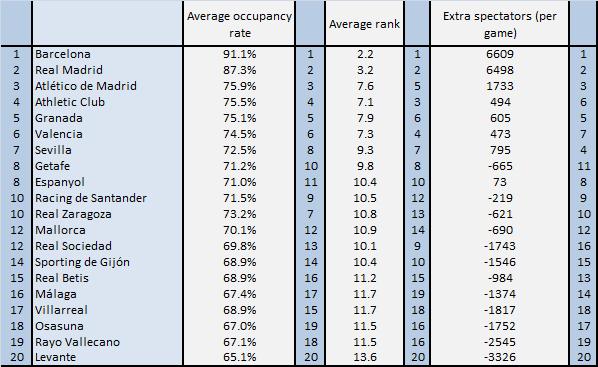
- Nobody will be surprised to find Barcelona and Real Madrid at the top, though Barcelona does have a small edge over their rivals from the capital.
- These numbers once more show how important Barca and Madrid are for the league. Whenever they come to visit, on average over 6,500 more people make their way to the stadium. The positive benefit of any of the other clubs is rather small.
- The clubs leading the pack after the Big 2 are who we expect there to be, though Granada is a surprise at 5th place. They will have to show similar numbers this season though before we place much value on that.
- The same is true for the bottom teams. Let’s wait one more season before we draw any conclusions.
The Serie A:
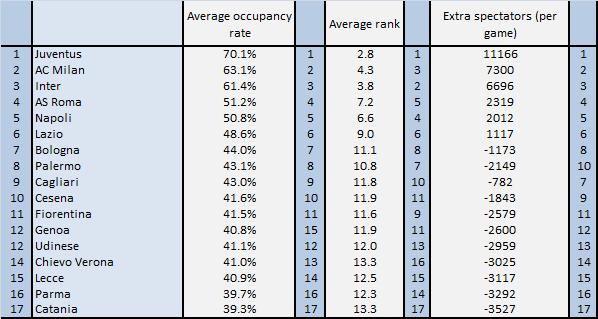 Our observations:
- The most appealing team in Italy is Juventus. No contest. The number two and three are both Milan clubs. No contest.
- Of all the leagues, the difference between the top and bottom clubs is biggest in Italy. People bother to come to the stadium when Juve or one of the Milan clubs comes to visit, but stay at home in front of the television when it’s only the likes of Catania or Parma. New stadiums could close this gap.
- The extra 11,166 tickets per match that Juve sells over the average is really astonishing.
- Roma, Napoli, and Lazio also sell significantly more tickets, but the other teams are all negatives. There are few differences between these teams, meaning that Italians are mostly indifferent to them.
There is a stark contrast between the Premier League and Bundesliga on the one hand, and the Primera División and Serie A on the other. Spain and Italy are both countries where many football fans support one of the few top clubs, irrespective of where they live. This is much less the case in England and Germany, resulting in much less differences between the clubs. This is, of course, even further exacerbated by the significant excess capacity most stadiums in Spain and Italy have.
Ligue 1:
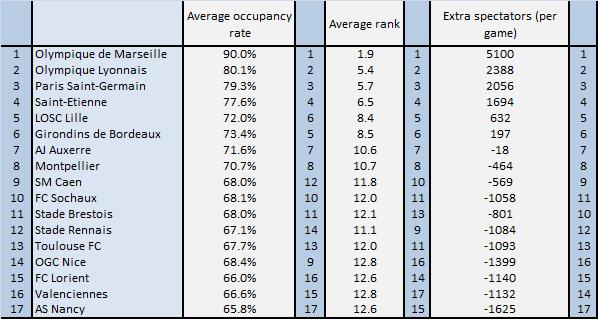
Our observations:
- Olympique de Marseille is the most appealing team in France.
- Paris-Saint Germain closed in a lot on Marseille in the last (2011-12) season, but still did not come near.
- The French seem to care more about a successful past than a great present. Saint-Etienne handily beat Lille in terms of appeal, and champions Montpellier attracted barely more people in their successful last season than the season before.
- It seems that Nancy was affected by a few exceptional attendances that pushed their occupancy rate down. In any case, the differences at the bottom are very small.
The Eredivisie:
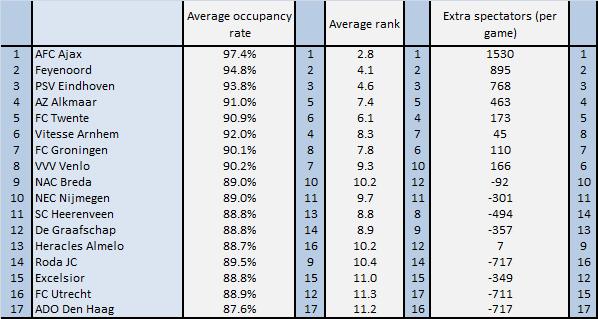
Our observations:
- Ajax ranks solidly at the top, and is followed by Feyenoord and PSV Eindhoven. They form Holland’s “Big 3”, so there is not much surprise here.
- Newly successful teams such as FC Twente and AZ Alkmaar have not been able to close the gap to the Big 3 in terms of popularity, and their positive benefit in terms of extra spectators is very limited.
- The number of extra spectators is somewhat lower in the Eredivisie than in other leagues due to the smaller capacities of the stadiums and limited free capacity. Still, apart from Ajax, there is relatively little difference between the clubs.
- The small differences at especially the bottom make that quite a few team rank rather differently depending on the metric we look at.
It is no surprise that many of the teams that only played one season in the top league would have ranked towards the bottom of the lists, though Blackpool was very popular in their one season in the PL and Swansea did well last season too. St Pauli also seems a club that can pull in the crowds, as do Lens and Monaco (though more modestly).
If we can take one thing from this analysis, it is likely that a club’s appeal seems to be much more driven by the past than the present. While we saw some effect of increased performance on away attendances for the likes of Gladbach and Paris Saint-Germain, this happens mainly when clubs already have an established past. It is much more difficult for rising teams such as Málaga, Udinese, and Montpellier to gain in appeal.
But apart from giving some fans extra bragging rights, should we place much value on the above analysis? Yes and no, but mostly no. Which is of course because there are many more ways to measure a club’s appeal than just away attendances. Most of all the home attendances (which are very solid for Stoke), but also many further variables not relating to attendances.
That said, measuring a club’s appeal becomes increasingly important, for example in dividing television money, and these numbers could just as well be one of the metrics used to determine such division. They are also likely to correlate significantly with the television audiences a team attracts.
But remember, nobody should be offended by these numbers as two seasons is a relatively short period to properly measure appeal. In the end, it is more just a fun analysis than anything else.
—————————————————————————————————————————————————
We promised some further statistical explanation for those interested:
We have chosen to use three metrics to measure the appeal of each club as each has its advantages, but also disadvantages:
- The first metric is the average occupancy rate of a club’s visits. The advantage is that this metric is easy to understand and that it treats all clubs and stadiums equally. The disadvantage is that one or two exceptional results can disproportionally influence the final averages. This is especially the case when difference are small such as in the PL and Bundesliga. One odd low attendance (e.g. on a cold Monday evening) may suddenly have a large impact, and therefore influence the final average.
- This effect is not there in the second metric, as it only looks at the rank and not the actual level of the attendance. One bad attendance does lead to a low rank, but this has significantly less influence on the final average. On the other hand, some bad luck can have its impact here as well. A club may sell only ten seats less at every match than the other clubs, but then finds itself solidly at the bottom, whereas the average occupancy rate would have been more or less equal. In reality, this problem does not tend to occur much though.
- The last metric really visualises the numbers. It is very comparable to the first metric in the sense that exceptional results can have a large impact, though there is a small difference with the first metric, which is that it weighs the larger stadiums (with many seats) heavier (2% of 50,000 is more than 2% of 10,000). The first metric takes the average percentages, which means that smaller stadiums weigh equal to the large ones. Neither is necessarily better than the other, but if you see differences between the first and third metric, it is because a club attracts more crowds at either the smaller or the bigger stadiums.
- Finally, there is a small statistical error in the sense that clubs with much free capacity have an advantage over clubs that almost always sell out. For example, Wigan does not have to visit the poorly-attended DW Stadium, but does get good numbers from Stoke’s Britannia Stadium. We have done some checks on this, but found the difference to be too insignificant to make complicated adjustments.